
Operational impact of USEC strike
For every week of strike on the US East Coast (USEC), more than 60 vessels will start to pile up outside USEC ports, and a third of them will be queueing outside New York. Every week of strike will lead to a capacity loss of more than 400,000 TEU, more than 1.4% of the global fleet, in turn pushing up freight rates, not just on the trades to the US, but likely across all major deep-sea trades.
In this article, we will drill down on the operational impact of the USEC strike: How many vessels will be impacted? What are the trades connecting to USEC? What ports do we expect vessels to queue outside? How much of the global fleet will be locked up inthestrike? How much time will it take for the shortfall of capacity to make its way back to origin regions in Asia and elsewhere? Can/will vessels be re-routed to theUS West Coast? How about dumping cargo in Canada? Or Mexico? Or Caribbean hub ports?
Methodology
All data for this analysis has beensourced from Sea-Intelligence’s proprietary Liner Shipping Schedules database, where we continually track container vessel schedules, across all deep-sea liner services, as well as most short-sea and feeder services, based on automated vessel schedules submissions from most major shipping lines. All data for this analysis was extracted based on the most recent schedules, on September 29thand 30th.
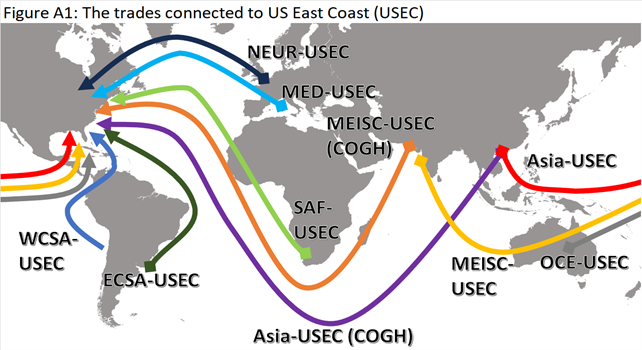
We have considered all deep-sea liner services that make regular scheduled port calls in North America East Coast (NAEC), i.e. both US and Canada East Coast ports, as well as on the vessels calling ports in East Coast of Mexico, and in the Caribbean hub ports. For a liner service to be included under the “deep-sea” label, the liner service must make regular scheduled calls in another region outside of NAEC. Figure A1 shows the 10 trades connected to NAEC/USEC.
We have intentionally excluded short-sea and intra-regional services from the analysis. Firstly, there are very few intra-regional liner services in NAEC, as the US Jones Act prevents non-US shipping lines from engaging in cabotage (i.e. intra-US) trade, leaving a tiny number of intra-US vessels operated by US Jones Act carriers. There are a few feeder services that connect US and Canada, but as the focus here is on vessels getting stuck due to the strike, it seems the best option for these very short distances, would be for these vessels simply not to pick up cargo in Canada, to then get stuck outside a USEC port. Similarly, for feeder services between Caribbean hubs and/or Mexico, and the US East Coast, we have assumed that the cargo is better served to remain in the hubs and Mexico ports, rather than getting locked in on a short trip to nowhere, while the strike is ongoing.
For all other deep-sea liner services into NAEC, we have first considered the proforma design of the liner service, i.e. the port rotation, the vessel sizes, the leg and roundtrip sailing times and distances, and the nominal supply of weekly capacity. This approach assumes, simplistically, that a vessel will depart along each port on the rotation, once every week, and is useful for considering the impact from a high-level network design perspective.
What such a perspective clearly fails at, is considering the actual tactical operations of liner services. Even at the best of times, sailings are blanked, vessels fall behind proforma schedules, ports are omitted, inducement calls are added, and port rotations can be altered. To capture this operational reality, we have mapped out the live vessel schedules, as of the latest vessel schedules release on September 29thand 30th, of every single deep-sea liner vessel scheduled to make a port call in NAEC ports during the month of October 2024, and traced each individual vessel to their respective trade lanes, as well as their full rotation within the NAEC region, and their onwards journey back to the origin region(s).
We have excluded any “To Be Named” (TBN) vessels, and only included real, physical, named container vessels. We have done this, as the TBN vessels are merely “on paper”, and with schedules in flux due to the ongoing disruptions, we see far too many of these “paper vessels” currently scheduled, especially for a single carrier, for them to be real. Moreover, as these vessels are all scheduled on services with a sailing time of more than 30 days from origin, these “paper vessels” should already have left the origin regions in order to make the scheduled NAEC calls in October, and that would have required them to be real vessels, which they obviously are not.
We have decided to exclude the following niche services:
- Independent Container Line (ICL), “Transatlantic Service” (NEUR-NAEC). As their latest submitted schedule was on September 17th, we have decided to not include the data. This service represents roughly 3,100 TEU/week, or about 5% of capacity of the NEUR-NAEC trade.
- Atlantic RORO Carriers, “Baltic – USA East Coast & Gulf” service (NEUR-NAEC) as their latest published schedule is from September 6th. While not a Roll-on/Roll-off service, as the name would suggest, rather they operate one 1,034 TEU and two 1,750 TEU multi-purpose vessels, sailing every three weeks, corresponding to an average of 504 TEU/Week, or about 0.8% of the capacity of the NEUR-NAEC trade.
We have, however, decided to include the following two niche services, although it could be argued that they are so niche, as to not be included:
- Eimskip, “Green Line” service, technically a NEUR-NAEC service, but it calls only Reykjavik, Iceland on the NEUR side, while it calls Portland (Maine), Halifax (Canada), and Argentia (Canada) in NAEC, with 3 weekly vessels on a 3-week roundtrip, averaging 883 TEU/week, or about 1.4% of the capacity of the NEUR-NAEC trade.
- CMA CGM/Marfret, “RTWPAN” / “Panama Direct Line” service, a 98day/14-week service, which despite its name is not a Round-The-World service, but rather a service that connects 17 ports, sailing:
NEUR-> NAEC-> Panama Canal-> Papeete-> Noumea> Australia-> New Zealand> Panama Canal-> NAEC > NEUR
In accordance with the defined methodology, we have identified a total of 331 deep-sea container vessels, scheduled to make a total of 981 distinct port calls in 20 distinct US and Canada East Coast ports, from October 1stto October 30th, 2024. Figure A2 shows how these currently scheduled port calls are dispersed across the 20 NAEC ports, for each day of the month of October 2024.
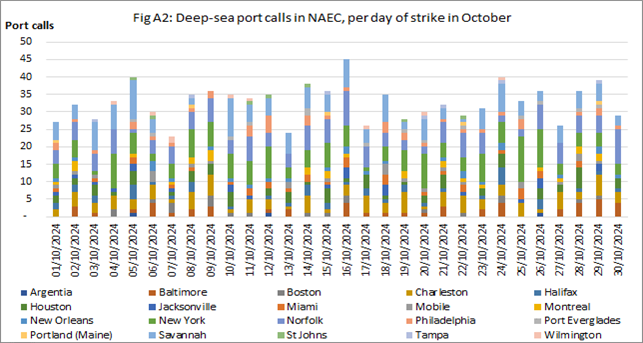
The number of scheduled deep-sea port calls per day, across all NAEC ports, varies from 23 calls scheduled for October 7th, to 45 calls currently scheduled for October 16th. 17.5% of the NAEC port calls are scheduled for New York, with a 172 total calls in October, and a daily average of 5.7 calls. 16.0% are scheduled for Norfolk (Total: 157, Avg: 5.2), 15.3% for Savannah (Total: 150, Avg: 5.0), and 10.3% for Charleston (Total: 101, Avg: 3.4). These four ports account for 59.1% of all NAEC deep-sea port calls in October 2024.
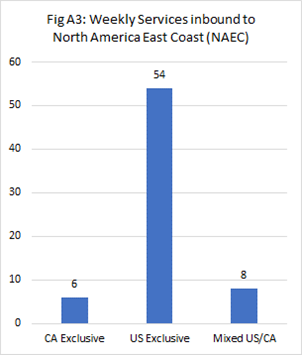
The 331 vessels are deployed across a total of 68 deep-sea liner services into NAEC, of which six services serve exclusively Canadian ports, 54 serve exclusively US ports, and eight serve a mix of US and Canadian ports, as shown in figure A3.
And this brings us to our first major methodological consideration:
What to do about Canada?
Astute readers will have noticed that when discussing geographical aspects in this analysis, we have very consistently referred to the destination region as North America East Coast (NAEC), which includes both US and Canada.
It is a long-established convention in this and other of our publications and data, that we always stringently adhere to actual trade definitions, and with approximately 7% of US-bound cargo coming in through Canadian ports, separating out Canada from the NAEC region is not straightforward. In figure A2, 81 (8.3%) of the 981 NAEC port calls in October 2024 are scheduled for the four Canadian ports of Montreal, Halifax, St Johns, and Argentia, of which 31 are made aboard Canada-exclusive services.
Figure A4 shows how the three groups of liner services are spread across the 10 different trades connecting into NAEC.
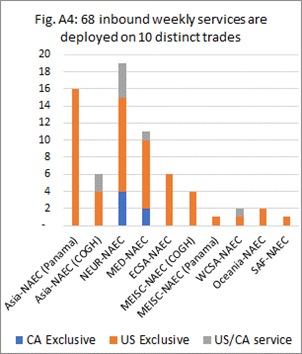
Figure A4 shows that the Canada-exclusive services are entirely confined to the Transatlantic trade lanes from North Europe (four) and Mediterranean (two).
Meanwhile, the US/CA-mixed services are also mostly related to NEUR (four services) and MED (one), while also extending to origins in Asia, with two services going round-Africa via the Cape of Good Hope (COGH), and one service from West Coast South America (WCSA).
But as the Canadian ports are not subject to the Master Contract for the US East Coast ports, the US strike does not formally extend to the Canadian ports, and in theory, it is “business as usual” in the Canada ports, although noting that the Canadian wing of the ILA initiated a 3-day strike in two terminals at the Port of Montreal on September 30th. The two terminals account for 40% of the port’s handling volumes, but at least officially, this is unrelated to the USEC strike.
In theory, the five Canada-exclusive services should not be directly impacted by the US strike, but the US/CA-mixed services will certainly be impacted, as, obviously, will the US-exclusive services.
Leading up to the strike, there has been plenty of speculation, as to whether the US-bound cargo could (to some degree) be off-loaded in Canadian ports. Firstly, it should be noted that from a simple infra-structure-perspective, there is simply no way, that the four Canadian ports on the East Coast, could make any serious dent in the totality of US-bound volumes, even if all of the vessels could be re-routed to Canadian ports. By our best estimates, Canada handles about 8.1% of all NAEC-inbound laden cargo, and again by our best estimates, the Canadian ports have excess handling capacity of about 10-15% over their “normal” handling volumes for October.
This means, that if the Canadian ports were pushed to their limits, they could at best handle 5% of the total US-bound volumes, and the end result would likely be a complete shutdown of the Canadian ports, as a consequence of what would be interminable port congestion in Canada.
Moreover, the members of the Canadian wing of the ILA are not going to sit idly by, if vessels on US-exclusive services are diverted into Canadian ports, and this would likely immediately extend the strike to the Canadian market.
In all likelihood, what will happen, is that the Canada-exclusive services will continue to operate largely unimpeded by the USEC Strike, to the extent that is possible, while the lines will try to dump as much of their US cargo from the US/CA-mixed services into the Canadian ports, but this is likely only going to work for a limited number of calls on these services, and if the strike drags on, the US/CA-mixed services will be stuck outside US ports, alongside the US-exclusive services.
For the remainder of this analysis, we will no longer consider the Canada-exclusive services in relation to the USEC strike, but then assume that the US/CA-mixed services will be impacted to the same degree as the US-exclusive services. This is obviously a simplification of the real challenges, but nonetheless one that is likely to balance out, on average. This now drops the number of weekly deep-sea liner services under investigation, from 68 to 62, and for the rest of this analysis, we will refer to the geographical designation as US East Coast (USEC), to reflect the impact from the USEC strike.
How about the West Coast?
Over the past several weeks, various market commentators have suggested that shipping lines could simply re-route vessels bound for USEC to the US West Coast (USWC), while the strike is ongoing in the East Coast. Alas, the metaphorical vessel has sailed on that option.
While we have certainly seen significant volume shifts from East to West in the weeks and months leading up to the strike, as well as a clear trend of some importers front-loading traditional 3rdquarter peak season volumes into May, June and July, once the containers are loaded onto a vessel bound for the USEC, then that is where the vessel destined to go, for several reasons:
Firstly, the only trades where a re-route to USWC would even be feasible, would be USEC services heading towards the Panama Canal, and then divert them to USWC ports. Vessels that have already passed through the Panama Canal laden with cargo, will realistically not be sent back out through the canal to a USWC port, as doing so would add at least 1-3 weeks to the transit time. As present, there are no certainty that the strike will take this long to resolve, so sending the vessels to the West Coast, could end up delaying the cargo for far longer than the length of the strike.
Secondly, even for the vessels that could conceivably be re-routed to the West Coast, would likely create a potentially bigger problem, as the customers’ containers are now on the wrong side of the continent, and for a majority of the customers on USEC-bound vessels, having their boxes stuck on the West Coast, would be much worse than being stuck outside of a USEC port, assuming that the strike will be resolved.
Thirdly, while the USWC ports have considerably more port capacity than the Canadian ports, we still quickly run into serious capacity restrictions. With the USEC ports handling more containers than USWC ports under normal circumstances, it would obviously be impossible to shift the entirety of the USEC volumes to USWC. But how much additional cargo can the USWC ports handle? We cannot say for certain, but the pandemic period may provide some guidance.
During the height of the pandemic disruptions, the west coast ports, especially Los Angeles and Long Beach in California, effectively ground to a halt, due to a higher-than-expected growth in laden volumes. How much did it take to break the West Coast ports?
Throughout the most demanding period of the pandemic, from July 2020 to December 2021, the seven largest ports in North America West Coast (Long Beach, Los Angeles, Oakland Seattle, Tacoma, Vancouver, and Prince Rupert) handled a combined 1.27 million TEU of laden imports per month, on average, with the single-highest month of May 2021, seeing a combined 1.45 million TEU of laden imports handled across the seven ports combined.
At this level of activity, the ports were pushed to the breaking point, leading to more than 100 container vessels queueing outside of LA/LB for several weeks, and it took several months to clear the backlog.
So where are we now, compared to this?
Well, in June 2024, these same seven West Coast ports handled 1.25 million TEU of laden imports. This increased to 1.39 million TEU in July, and then to 1.36 million TEU in August. This suggests that we are effectively already at capacity in the West Coast ports, and any significant increase in laden imports would likely lead toa complete shutdown of the LA/LB complex, with port congestion and vessel queues on the West Coast.
The West Coast ports have seen Y/Y growth rates in laden imports of 21%, 41%, and 27% in June, July, and August, respectively, and the obvious reason for this boom, is exactly because of savvy importers, moving what volumes they could from East to West. We’re not going to see USEC vessels diverted to USWC, as any boxes that could feasibly go to the West Coast, have already been moved onto USWC services.
Finally, even if all of the above practical challenges could somehow be overcome, there is one fundamental challenge that does not have a practical solution: The West Coast ports have their own, powerful port labour union, the International Longshore and Warehouse Union (ILWU).
While the ILWU have at times been at odds with their East Coast brethren in the ILA, there is one guiding principle they’ll never violate: They won’t be seen as strike-breakers. If a vessel was re-routed from East to West, the ILWU would likely refuse to handle that vessel, following long-established principles between the two unions. So now the vessel is still stuck outside of a US port, just now on the wrong side of the continent.
The USEC-bound liner services
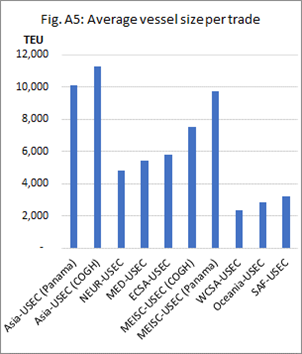
Figure A5 shows the average vessel size across the 10 deep-sea trades that connect to USEC, across the 62 deep-sea liner services that call at least one USEC port on its standard rotation (i.e. US exclusive + US/CA-mixed services).
There are striking differences in the average vessel sizes deploy on each trade, with the Transpacific services from Asia to USEC fielding the largest vessels, averaging 10,103 TEU going through the Panama Canal, and 11,309 TEU going via COGH around Africa.
The Transatlantic services from MED and NEUR, as well as from East Coast South America (ECSA) have an average vessel size of 4,800-5,800 TEU, while the services from the Middle East and Indian Subcontinent (MEISC) average at 7,524 TEU and 9,744 TEU, going via COGH and the Panama Canal, respectively.
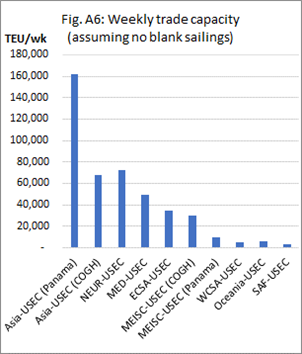
Figure A6 shows the nominal weekly trade capacity for each of the 10 trades, calculated simply by multiplying the number of liner services per trade from figure A4 (excluding the Canada-exclusive services), with the average vessel size from figure A5.
Figure A6 effectively tells us the “network design trade capacity”, as this would be the available weekly supply in each trade, if every service had a sailing each week. In total, the trades into the US East Coast are designed to provide a total of 445,999 TEU of capacity per week, with the Transpacific trades from Asia (via both Panama Canal and COGH) accounting for half of the USEC inbound supply, with the Asia-USEC combined weekly design capacity totalling 229,493 TEU/week.
The two Transatlantic trades from NEUR and MED account for 27% of the USEC inbound supply, ECSA accounts for 8%, while the two trades from MEISC account for 9%. The three smaller niche trades only account for 1% each.
If indeed every liner service into the USEC saw an average-sized vessel deployed each week, and every vessel would end up stuck outside the first USEC port on the rotation, then the 445,999 TEU of supply per week, would equal the capacity that would be lost from the global market supply. When a vessel doesn’t sail it is not “producing” any supply.
With a global container shipping fleet of approximately 30.8 million TEU of capacity, from this “network design” perspective, we would lose 1.4% of the global container shipping fleet, for every week the strike runs. Obviously, this supply loss would only be for the extent of the strike impact, and once the vessels are back to normal rotation, the supply is restored.
As noted in the methodology section, even at the best of times, liner services are subject to frequent blanked sailings, extra-loaders, vessel delays, and changes to the port rotation. In the following, we will account for these tactical, operational adjustments to the liner services.
Vessel queues and fleet loss
As mentioned in the methodology section, we have mapped out every single port call scheduled across all vessels deployed on all deep-sea services, that currently are scheduled to make call in a USEC port in October 2024.
We will in the following assume that container vessels bound for at least one USEC port, will effectively park outside the first USEC port in the rotation. As mentioned above, some vessels call Canadian ports en route to a USEC port, and we have assumed that they will make these calls as intended, and then continue towards the first USEC port.
As mentioned above, it will be both physically impossible, as well as strongly opposed by the Canadian wing of the ILA, for the Canadian ports to absorb any significant share of the US-bound cargo.
Moreover, we have assumed that the same will apply to any intermediate calls in Panama, across any Caribbean hub ports, as well as for the few services that call Mexico en route to USEC. For all of these, we assume that these en-route port calls will be made as planned, before the vessels ends up anchored outside the first USEC port call.
We cannot say for certain, that this is exactly what will happen, but there does not seem to be any real alternatives. Surely, some shipping lines will dump as much cargo as they can in these ports, and a few sailings have last-minute been scheduled to completely omit any USEC ports, but the options to do so are very limited, and these alternative ports will quickly clog up if too much USEC cargo is dumped in them, which will merely serve to exacerbate the growing congestion challenges.
What we can say, is that when vessels could not get into ports during the pandemic, the only viable option back then, was to simply drop anchor and wait for when you could enter the port. There was no significant re-routing of vessels and cargo to Canada, Mexico, or the Caribbean. No fanciful journeys to less-obstructed coasts. And the pandemic disruptions had a much longer expected time horizon, than even the presently most-pessimistic fears of how long the USEC strike will last.
Figure A7 shows the length of the container vessel queues, at specific ports, for varying lengths of the strike, from one to four weeks.
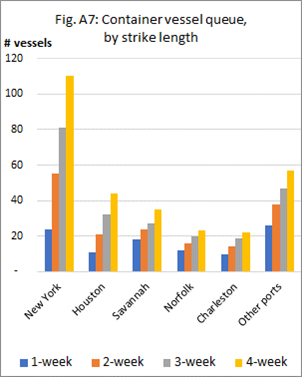
Port of Houston sees the second-largest number of first-port-in-USEC calls, as it is the closest major port when coming from the Panama Canal. Here, a 1week strike would lead to a queue of 11 deep-sea vessels, increasing to 44 vessels for a 4-week strike. Savannah, Norfolk, and Charleston will also see long queues.
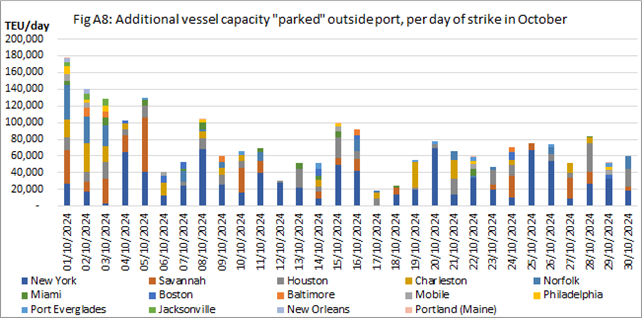
Figure A8 breaks down these arrivals and anchoring at first USEC port, to a daily level, measured as the combined TEU vessel capacity, rather than just the number of vessels, across every single day throughout October, across all 14 ports that serve as first call in USEC (for anyone wondering, how we went from 20 ports in figure A2 to 14 ports in figure A8, this is due to four Canadian ports that cannot serve as first USEC port, and Tampa and Wilmington not serving as first USEC port call on any of the scheduled sailings).
Figure A8 shows that the timing of vessel capacity arriving in first USEC port throughout October, is clearly not evenly distributed, with a very large relative share of the month’s capacity arriving at first USEC port in the first week of October, with the daily added amount of parked capacity peaking at 178,316 TEU on October 1st, before settling in at a range of around 60,000 TEU added per day after the first week.
This could at first blush suggest that the shipping lines were caught off-guard by the strike and have been rushing to sail vessels into USEC ports before October 1st, with large numbers of vessels missing the deadline, especially in the ports of Savannah, Norfolk, and Charleston. While there is likely to be an element of “missing the boat”, the primary reason for this is rather benign.
When the strike started on October 1st, there was several vessels progressing through their “normal” USEC port rotation, and on October 1st, the next call in USEC became their first USEC call after the strike had started, even though they had already been calling ports in USEC on this voyage. As the three mentioned ports are more likely to be called after New York or Houston, they are more likely to figure in the first 5 days. After about a week, new vessels enter the USEC region, and we see a more stable flow.
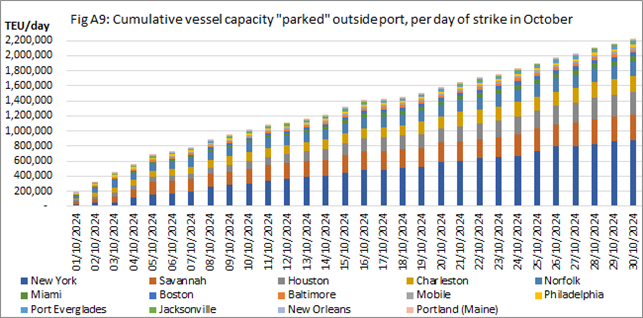
Figure A9 shows us that if the strike should run for a week, then the cumulative amount of vessel capacity that is stuck in USEC ports, will amount to 774,865 TEU, or roughly 2.5% of the entire global container shipping fleet. Should the strike last for the entirety of October, then 2.22 million TEU of container shipping capacity will be unable to move, equal to a loss of 7.2% of the global container shipping fleet.
The 1-week strike figure might seem surprisingly high, especially when considering that in figure A6, based on the estimate of “nominal weekly trade capacity”, it was assumed that if all of the USEC-bound services were stopped, it would equal a loss of 1.4% of the global fleet, per week of strike. One would assume that once the proforma is adjusted for real schedules and blank sailings, the figure would be lower, not higher.
The explanation for this apparent aberrant behaviour, is the same as the “missing the boat” conundrum above: The shipping lines are not only pushing a full contingent of capacity from the 62 deep-sea services into the USEC region every week, when the strike started on October 1st, there were several vessels already sailing in USEC region, getting stuck at the next USEC port call, while additional vessels are pouring in. During the first week, the capacity loss is due to both sets of vessels, but from week 2 onwards, the additional capacity loss in only from “new” vessels entering the USEC region.
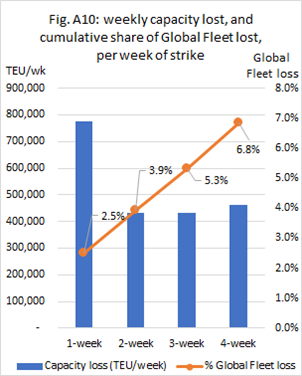
Figure A10 puts these figures into perspective, by comparing the amount of (additional) capacity lost per week of strike (blue bars, left-hand axis), with the cumulative share of the global fleet, that these weekly capacity losses represent (orange line, right-hand axis).
We see that after the initial week of 774,865 TEU of capacity being lost, from both “new” vessels entering the USEC region, as well as vessels already in the region, the lost share of the global fleet of 2.5%, drops significantly after the first week. For weeks 2-4 of a strike, the additional lost capacity amounts to about 443,000 TEU/week, which is equivalent to about another 1.4% share of the global fleet being lost, each week of the strike. This tracks almost perfectly with the estimates based on figure A6.
Now this is where it gets a bit scary.
Long-time readers of the Sunday Spotlight will know that, throughout the pandemic, as well through the ongoing Red Sea Crisis, we have tracked and provided monthly updates on the loss of global capacity, due to container vessels being stuck in congestion in ports around the world (an update is scheduled for the next-coming issue of the Spotlight). As the adage goes, “a vessel only makes money when it’s sailing”, and likewise, a vessel only “produces” capacity when it’s sailing.
Throughout the pandemic and Red Sea crisis periods, we consistently proved a +90% correlation between the loss of global fleet capacity and spot rates, both for global indices, and for individual trade-level spot rate indices. We found that for each percentage point increase in the loss of global fleet capacity, spot rates on Asia to USEC would increase 993 USD/FFE, while Asia to USWC spot rates would increase 805 USD/FFE.
If this relationship still holds true, then it would suggest that the first week of strike would see spot rates increase 2,000 USD/FFE on Asia-USWC, and 2,500 USD/FFE on Asia-USEC. For each subsequent week of the strike, this model suggests that spot rates will increase by 1,100 USD/TEU on Asia-USWC, and 1,400 USD/TEU on Asia-USEC.
We note here that the increases in spot rates are NOT tied to the trades where the capacity loss happens, but rather through rate contagion, ALL deep-sea spot rate indices are affected by similar levels, adjusted for any trade-specific supply/demand factors.
We should stress, that we are not conclusively saying that spot rates will go up by a certain amount for every week of the strike, but merely, that this is what our model suggests. Clearly, there are vastly different underlying market drivers of, respectively, a global pandemic, regional hostilities leading to a Suez Canal closure, and a labour strike in USEC ports. That said, there is nothing in the way of these different underlying drivers, that would expressly invalidate the model.
More importantly, the impact of capacity loss is rarely relevant in terms of the head-haul trade destinations: That there are vessels stuck in USEC in a given week, has a minimal impact on the spot rates into USEC in that week, as there is only low demand for moving laden back-haul containers out of USEC, as well as the need for empty equipment repositioning. Effectively, the “missing” vessels aren’t really missing in USEC. No, they are missing “x” weeks later in Asia, and other origin regions.
As we have not only mapped out all USEC port calls in October, but also the onwards voyages out of USEC, we can predict when the vessels and capacity will be missing in the origin regions.
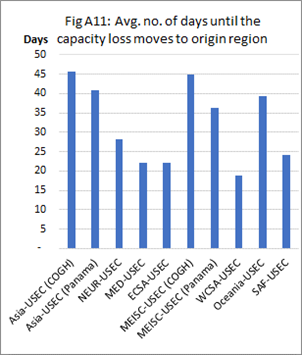
Figure A11 shows the average number of days, from the first port call in USEC, until the first scheduled port call in the corresponding origin region. Unsurprisingly, the Transatlantic, South America, and South Africa routes take a shorter 3-4 weeks to progress to the origin region, while the longer routes to Asia, MEISC, and Oceania take 5-6 weeks for the capacity loss to move out to the origin regions. As the length of time will vary considerably across individual services, even within the same trade, it is not as simple, as just adding the days in figure A11 to those in figures A8/A9.
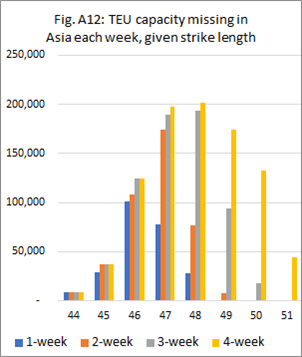
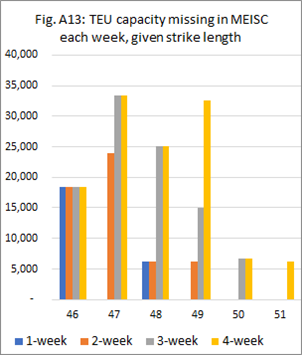
Figure A12 shows how much capacity will be missing in Asia in individual weeks, based on the length of the strike, from 1 to 4 weeks. To calculate this, we have mapped every first call in USEC to the corresponding first call in the origin region.
Figure A12 shows that with a 1-week strike, we should expect to see capacity loss in Asia gradually build up to around 100,000 TEU in week 46, and then start declining over the next two weeks. A 4week strike will see Asian capacity loss peak at 200,000 TEU/week in weeks 4748, and then slowly subside over the next three weeks.
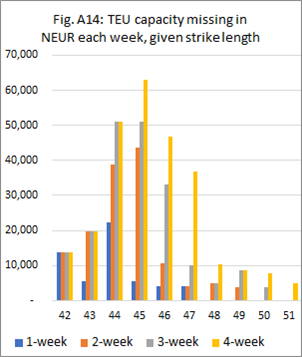
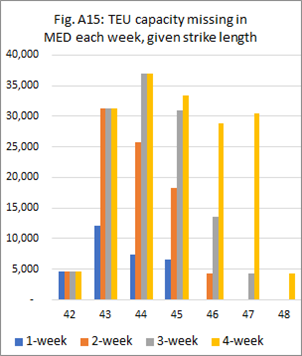
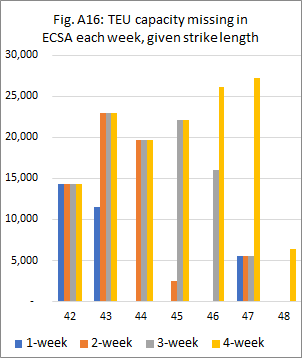
Figures A13-A16 show the same as A12, but for the MEISC, NEUR, MED, and ECSA origin regions.
Concluding remarks
We traditionally end most of our analyses with a cold and emotionless summary of our findings, and we very rarely “pollute” our analysis and conclusions, with our own subjective interpretations of market developments. We usually put great effort into relegating our speculative “market commentary” to just the 1-page editorial, at the front of every Sunday Spotlight, so as not to sully our cold analytical truths with the conjecture, speculation, and rumours, that come from interpretation rather than analysis.
But given the vast levels of concern and uncertainty on this topic, from not just our industry peers, but also from the wider public outside the world of boxes, boats, and supply chains, we have decided to replace the usual conclusion, with a softer “concluding remarks” section, focusing on the main concerns and considerations of the USEC strike, as the Sea-Intelligence editorial team sees them, at time of writing:
It all comes down to the length of the strike.
This is likely the most important take-away, as the strike could very well, albeit unlikely, have concluded by the time these words are being written. If indeed the strike is resolved within a matter of days, then this will have been a terrifying and stressful few days, but all-in-all, the ramifications will have been limited.
Having talked to many industry participants over the past few weeks, an altogether unscientific consensus estimate, suggests that this will likely take 1-2 weeks to get resolved, but this is pure speculation, based on nothing but gut feelings. There has not been a strike on the East Coast since 1977, but back then it lasted for 44 days. All indications though suggest that, with so much more at stake this time, it should not take as long for a resolution this time.
If the strike lasts for a week, then we’re going to see some real lasting damage: Perishable goods will start to spoil (not just food, medicines as well), bananas are ripening in yards and on vessels, seasonal importers with goods coming in for the holiday season will miss the window, and some will be looking at bankruptcy.
At two weeks, well, to quote the always charming president of the ILA, Harold Daggett: “Second week, guys who sell cars can't sell cars because the cars aren't coming in off the ships. They get laid off. Third week, malls start closing down. They can't get the goods from China. They can't sell clothes. They can't do this. Everything in the United States comes on a ship.
Construction workers get laid off because the materials aren’t coming in. The steel’s not coming in. The lumber’s not coming in. They lose their job. Everybody’s hating the longshoremen now because now they realize how important our jobs are. […] I will cripple you, and you have no idea what that means”.
If the strike lasts for more than a month, then by our best estimates, it will almost invariably push the US economy into a recession. And as the US goes, so goes the world. It is difficult to put a dollar value on the costs of supply chain disruptions, but various economists have suggested that the daily cost of the strike could run anywhere from USD 300 million to upwards of USD 5 billion.
Considering that US laden imports are roughly 75,000 TEU per day, a fairly “mild” increase in average US freight rates of 2,000 USD/TEU, would cost importers USD 160 million. If we assume the rest of the World’s 400,000 TEU/day also see an increase in rates of 1,000 USD from the loss of capacity, the total cost increase – just in terms of freight rates – is USD 560 million/day. Now add in the costs of spoilage, lost seasonal sales, inventories, exception handling, clearing the backlog, etc., and the high end of the estimates does not seem that unreasonable.
There are three separately timed impact horizons
- Firstly, there is the immediate impact of cargo stuck on vessels and in ports. Perishables goods will start to go bad, and products will start to bemissing from inventories and shelves, while importers and logisticians scramble to find solutions. Freight rates intotheUS West Coast will likely come under pressure, and shipping lines have already started to implement heavy “work-dispute” surcharges of +3,000 USD/FFE.
- Secondly, there is the delayed impact of when the vessel capacity will be missing from the origin regions, most notably in Asia, where vessel and container shortages will start to manifest around 5-6 weeks after the start of the strike. This will push up freight rates in global markets, not just to the US.
- Once the strike is over, the backlog needs to be cleared, which just in terms of handling the containers on the vessels waiting in ports, along with the normal flow, will take roughly 5-6 days to clear, for each day of strike (see issue 677 of the Sunday Spotlight). This is just for the handling of the boxes from ship to shore and does not account for all of the exception handling needed to get land-side flows back to normal, nor does it include the time to get liner networks back to normal.
When the ILWU ended their labour dispute in West Coast ports in March 2015, it took 8-9 months, before vessels to USWC were back to a normal level of schedule stability and reliability.
For all three, the most important impact determinant is again the length of the strike.
The West Coast is not an option. Neither is Canada, Mexico, or the Caribbean
As we covered in this analysis, there issimply not enough space in the West Coast ports, it would be too time consuming to re-route vessels, and any cargo that “would want to” move to the West Coast, likely already has. Moreover, the West Coast port labour union, ILWU, will likely block any vessel diverted from USEC.
Global fleet loss may surge freight rates
As we detailed in this analysis, over the pandemic and the Red Sea crisis, we find there is very strong correlation between global fleet loss and spot rates. This strong correlation suggests that the first week of strike may push up US spot rates by 2,000-2,500 USD/FFE, while subsequent weeks of strike will push up by an additional 1,100-1,400 USD/FFE. Note that due to rate contagion during capacity shortages, these increases would not be limited to the US-bound trades, and most deep-sea trades are likely to see similar increases, as we saw during the pandemic.
The government won’t save us
While the US President does have the power to wield the Taft-Hartley Act and force the union members back to work for a 80-day “cooling-off period”, we find it exceptionally unlikely that the Democratic administration will go to war with a major union, one month before the Presidential election. Moreover, the ILA have made it very clear, that while they could be forced back to work, they would retaliate through a “go slow” action, where they would strive to be even less efficient than normal, which would be an impressive feat.
The timing is just perfect for the ILA, as the market is already suffering from major capacity restrictions, as the Red Sea crisis – forcing shipping lines to go around Africa on Asia-Europe – has soaked up all of the excess capacity in the system. If the Red Sea crisis had not happened, then the strike would still be devasting to those directly impacted in USEC, but a considerable capacity slack would have prevented the spillover and rate contagion onto other trades.
In addition, the devastating effects on the US economy and infrastructure will not be felt until after the election, so any major public backlash against the union, will likely not come before the election. With public outcry and outrage not likely to happen until the holiday season is badly impacted, long after the election, it seems safe to assume that most politicians will avoid touching this conflict.
Moreover, the ILA have very deftly played this to both sides of the aisle, painting their opposition at the terminals and shipping lines, as anti-American, foreign billionaire multinationals, with vast sums of money and endless profit levels, intent on destroying the poor blue-collar longshoreman. As is often the case, the shipping lines are their own worst enemies, as they have done little to dispel such notions to the US public, especially after the huge rate increases over the pandemic, prioritising empty repositioning over US exports, and just all-round abysmal service levels.
No rational US politician will go to bat for the foreign multinationals, especially not in an election year.